I have a peach tree already waking up…this pic was from Sat Jan 21, and last freeze around here is usually early March (edit that…just checked some data and we are likely to get frost up until early April):
The extremes here, along with a couple thousand tons of road salt…mixed in with snowplows is tearing apart the roads. The potholes are man eaters right now. I saw a crew out this morning patching. Good way to test those tooth fillings
I bought this tree two years ago from Lowes and it was labeled as a Red Chief nectarine (a white fleshed nectarine)…the first year I had 2 yellow peaches and last year I had about 12 peaches. It has always been very early bloom and the peaches are ripe mid to late may so to sum it up I have no idea what peach it is, but is is an early bloom early harvest yellow peach. It is a healthy tree and growing nicely, but not a good peach for my location…i have never grafted anything before but will try out grafting on this tree with some more appropriate selections.
My blueberries look like they are about to flower and I have two pear trees with buds starting to swell (Ayers, Moonglow). Blureberry blooms at times amaze me at how cold tolerant they can be.
While eating lunch I dropped the temperature data for the period 12/1 to 1/23 into excel and calculated chill hours between 34 and 48 degrees. I modified the Utah model because I didn’t want to deal with all the half-units of chill and assumed 1 unit for each degree between those temperatures.
2011-2012 to date: 354 units
2012-2013 to date: 337 units
2013-2014 to date: 155 units
2014-2015 to date: 286 units
2015-2016 to date: 341 units
2016-2017 to date: 385 units
6-year average: 310 units
So we are ahead of average chilling for now here in SE IA. Assuming that 12/01 is a reasonable start date to start calculating these. I base that off when apples usually get froze out… but I think stone fruit usually have gone dormant here by 12/01. Fortunately we still have almost 30 days of chilling to accumulate before we have gone into the ranges required for bud break.
But hey, chill hours don’t matter too much for us except to worry mid-winter… ha! It could warm up in April and freeze on May 10 for us…
I know i’ve brought in container trees out of the garage in late Jan and they bloomed… from the time i take them in until they wake up (55F basement) is about 3 to 4 weeks).
Some hints at much colder weather that 1st/2nd week of Feb around here.
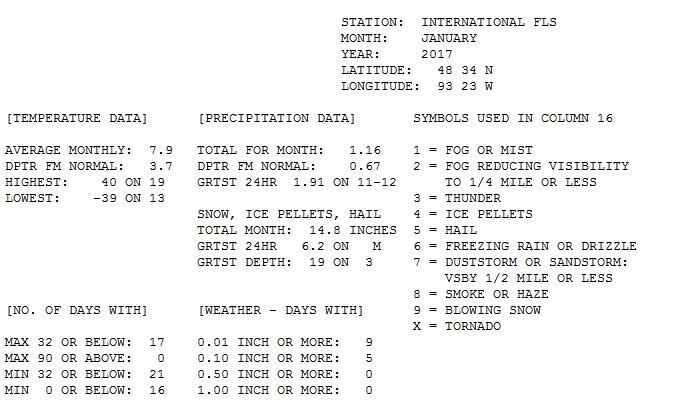
Every NWS should have that same data…just have to pic the preliminary monthly data and then go over and pic the location/month you want… from there its a prt scr and crop jobby in ms paint (yes…i use ms paint still)
Which is annoying because a lot of the data is missing or you have to find another station… I did save a bunch of decades of local data a few years back that i can bring up in a spreadsheet and dig through.
I wish the NWS would just get their #### together and have all available data, from every year they have on record in a easy to access location. List it by decade or by year, day… …you put in a data, or a range of dates…its spits out data.
Lots of snow still around here even with the current extended Jan thaw . It has been in the 30s and dense fog for about a week ! Supposed to finally turn back to winter starting tomorrow . Been a mess much of the winter with temps getting just above freezing after a cold spell then wet snow/rain on frozen surfaces causing a build up of ice .
OK, we are beginning to sweat it here in the deep South with this warm weather after a hard freeze. We’ve had over 2 weeks of high 70s and even a low 80s day. My pears are breaking bud, and its way too early. The photos are of my Southern Bartlett.
Mine are not quite as far along as yours but I noticed the buds are softening on several of mine. Hosui and Dabney are really moving along. Earliest I ever remember this is crazy even for Texas!


 (yes…i use ms paint still)