These are three locations from my area in Redmond,WA.I tried to find the ones that are similar in elevation as where my place is.I included these because they varied a bit. Brady
The data started collecting on 11/1/2015
Below 45 Model: 1576 chill hours
Between 45 and 32 Model: 1299 chill hours
Utah Model: 1630 chill units
Positive Utah Model: 1630 chill units
Dynamic Model: 68 chill portions
Below 45 Model: 1418 chill hours
Between 45 and 32 Model: 1214 chill hours
Utah Model: 1656 chill units
Positive Utah Model: 1656 chill units
Dynamic Model: 68 chill portions
Below 45 Model: 1248 chill hours
Between 45 and 32 Model: 1073 chill hours
Utah Model: 1549 chill units
Positive Utah Model: 1550 chill units
Dynamic Model: 64 chill portions
Since Dec. 1st, we’ve had 439 Growing Degree Days for corn.
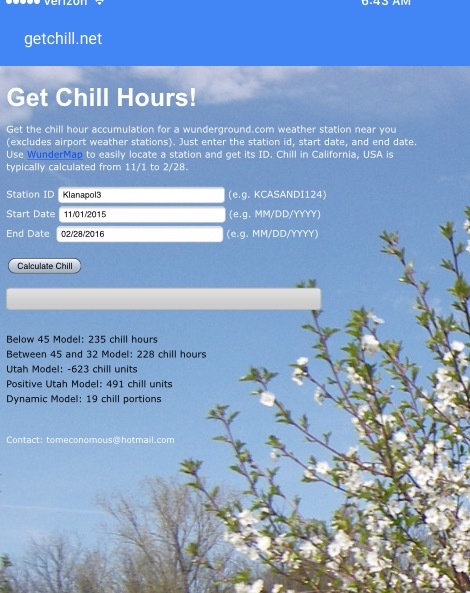
Oh, wait. I must be as eager as some of our trees. Chill accumulations from Dec 1 to Feb 2:
Below 45 Model: 568 chill hours
Between 45 and 32 Model: 483 chill hours
Utah Model: 78 chill units
Positive Utah Model: 763 chill units
Dynamic Model: 32 chill portions
I do suspect, however, that some of the more advanced fruit bearers are no longer accumulating chill. Rather, the hours spent in what would have been chill time during a more normal season are now simply hours that are not growing degree hours. In other words, not accumulating, but still helping to hold off full bloom. Maybe someone who knows more about this will set me straight in my thinking.
These two stations are each within a couple miles of me and I think that my chill hours are somewhere between them. The date range is 2015.11.01 through 2016.02.28.
Below 45 Model: 564 chill hours
Between 45 and 32 Model: 564 chill hours
Utah Model: 1237 chill units
Positive Utah Model: 1355 chill units
Dynamic Model: 57 chill portions
Below 45 Model: 1038 chill hours
Between 45 and 32 Model: 1028 chill hours
Utah Model: 1583 chill units
Positive Utah Model: 1607 chill units
Dynamic Model: 66 chill portions
Oddly, I saw a plum nearby in bloom this morning, while it has been in the 30s at night the last few days and daytime high hasn’t hit 60 yet. Last year was a very low chill year for my location, perhaps those effects are still being felt.
The Weather station is a 1/4 mile from my house!
Sterling Heights, MI
Below 45 Model: 1623 chill hours
Between 45 and 32 Model: 929 chill hours
Utah Model: 904 chill units
Positive Utah Model: 957 chill units
Dynamic Model: 52 chill portions
I noticed that too, and the differences between stations is quite large too. I’m in zone 5b/6a and zone 10a beats me in some models? Wow!
Well here February is the coldest month and March is going to have a lot of temps in the chill range. So mine should change a lot yet.
Also I don’t trust that calculator as very accurate. When i ran last year’s numbers it was lower even though it was cold forever and this has been a warm year. The Below 45 should have been off the chart. It cannot be correct.
11-01-14 to 02-28-15
Below 45 Model: 959 chill hours
Between 45 and 32 Model: 69 chill hours
Utah Model: 25 chill units
Positive Utah Model: 25 chill units
Dynamic Model: 6 chill portions
Same time period but last year. This cannot be correct. Also did you notice the end date? It’s giving future chill hours too? (02-28-16) Last I looked it’s the 3rd!
Only 69 hours in the 45-32 model? That seems way wrong too.If it is accurate than we can ignore this number as my trees fruited fine.
OK I extended range for last year from 11-01-14 to 04-28-15
This looks more like it.
Below 45 Model: 1895 chill hours
Between 45 and 32 Model: 700 chill hours
Utah Model: 658 chill units
Positive Utah Model: 719 chill units
Dynamic Model: 44 chill portions
My last frost date is 05-15.
For me this info is not useful, I get enough no matter what. More useful for the warmer regions. I don’t really need to pay attention to this data.
South Louisiana, zone 9
228 so far, last year we had 663. It’s been a very warm winter this year for us. Feb. is our coldest month though.
Hopefully we can rack up some more chill hours .
Bixby Oklahoma, 6b winters, 8b- 9a summers LOL. average last frost April 5th.
our biggest problem is we inevitably will have more than enough chill hours by January, then always a couple of really warm spells in january and february. Then a big freeze right at bloom or later. Local commercial peach farms are always running fans and hiring helicopters.
Below 45 Model: 1274 chill hours
Between 45 and 32 Model: 883 chill hours
Utah Model: 702 chill units
Positive Utah Model: 952 chill units
Dynamic Model: 51 chill portions
Bucyrus KS/Cleveland MO - Pleasant Hill MO station
From 11/1/15 to 2/3/16
Below 45 Model: 734 chill hours
Between 45 and 32 Model: 635 chill hours
Utah Model: 936 chill units
Positive Utah Model: 1090 chill units
Dynamic Model: 53 chill portions
Eric, it’s hard for me to believe we are behind you in chill hours (45 and 32 model) but maybe so. Nov. and Dec. seemed like they had very few days below 32 or above 45. Ideal for chill accumulation.
Ive learned thru the years of tracking chill hours that its not hours below 45 that count. Its utah hours and dynamic chill portions. Last year we had almost equally high below 45 numbers but very low utah and dynamic hours and saw lots of sign of classic lack of chill. This year our utah and dynamic hours are decent…
Below 45 Model: 145 chill hours
Between 45 and 32 Model: 145 chill hours
Utah Model: 205 chill units
Positive Utah Model: 523 chill units
Dynamic Model: 22 chill portions
Eric, hope you’re right. We usually go by Utah numbers, and that seems to be a pretty good indicator for us if we’re going to get decent fruit set. Not bad so far.


 zone 9