A few folks were asking me about how to get started with QGIS, an open-source mapping software. I’ll do what I can to get you started with finding data, making your own, and putting it together on a map. This is not intended to be a comprehensive tutorial, read the docs here: QGIS User Guide — QGIS Documentation documentation or look for tutorials on YouTube, etc. It will still be a long read, so buckle up and enjoy the ride.
Caution: QGIS is fairly lightweight as GIS software goes, but it can still use a lot of PC resources. Extra RAM and a separate graphics card will help tremendously. That being said, I’m successfully using this on my middling laptop.
What you’ll need:
QGIS Software https://qgis.org/
ArcGIS Online account (free is fine) https://www.arcgis.com/index.html
Some terms to know:
- Spatial data: data that stores item’s location and info about those items
- Vector data: spatial data in the form of points, lines, or polygons
- Raster data: spatial data stored as pixels. Imagery, elevation, etc.
- Shapefile: locally stored “lingua franca” format for spatial data
- Feature Service: data accessed via a web server (such as ArcGIS Online).
- Coordinate Reference System (CRS): the system used to plot coordinates on Earth onto a 2D map. There are many
- Symbology: how the spatial data is displayed
- Geometry: the “where” part of the spatial data
- Attributes: data table associated with the spatial data. Stores info about the items
Start by downloading QGIS. I recommend downloading the Long Term Version (3.4 as of this writing) unless you feel like you need the more cutting edge, experimental features. Consider donating when prompted, but it is free to download, use, and distribute. Install QGIS and open it.

Once QGIS is installed, you’ll want to open a new project. Look at the screenshot below for some orientation.
- Menus
- Data Sources
- Table of Contents/Layers
- Create New Shapefile
- Map Pane
- Project Templates (click here to create new project.

Your new project starts out with a CRS of WGS 84. This an unprojected, Lat/Long only CRS. Depending on the data you find, we may change this. First thing you will need to do is find some data to add. You can search for data to download (check local and state government sites), but that’s a whole different topic. An easy way to get started is by looking for publicly available map services published to ArcGIS Online. Go to ArcGIS Online (see link above) and create a free account. Note: you could use ArcGIS online to do your mapping, and they have many great learning resources. With a free account, you are unable to keep your data private. But I digress…
Click on the magnifying glass at the top of the page to search for layers. Let’s start with Imagery (aerial and satellite photos). I’m going to search for New Hampshire Imagery. The results show me a number of Image Layers from a repository run by UNH. You may or may not find something similar for your region. If you have too many options, you can try clicking on the filters on the left. “Layers” will only show you Layers, and hide fully built maps and apps.
I chose this USGS NH 2021/22 6 inch orthophotos (RGB). To decode that, 6 inch is the average size and location accuracy of each pixel on the Earth’s surface, “orthophoto” means the imagery has been corrected for topography, and RGB means that it’s true color imagery. You may also see CIR imagery, which is color infrared. It looks freaky, but it’s useful for telling vegetation from other things.

Anyway, I click on the imagery item and select view details. Then, I scroll down to the bottom and look for the URL on the right. Click the button to copy to your clipboard, then return to QGIS.

In QGIS, in the Browser pane, find the ArcGIS REST Servers entry and right click it. Select New Connection.

In the popup, paste the URL in the URL field, and enter an easy to remember name in the Name field. Click OK to add the data source. You should now see dropdown arrows next to ArcGIS REST Servers in the Browser.Tip: If you find the REST directory for your state’s GIS Repository, you can add it in the same way and just browse all layers in it.

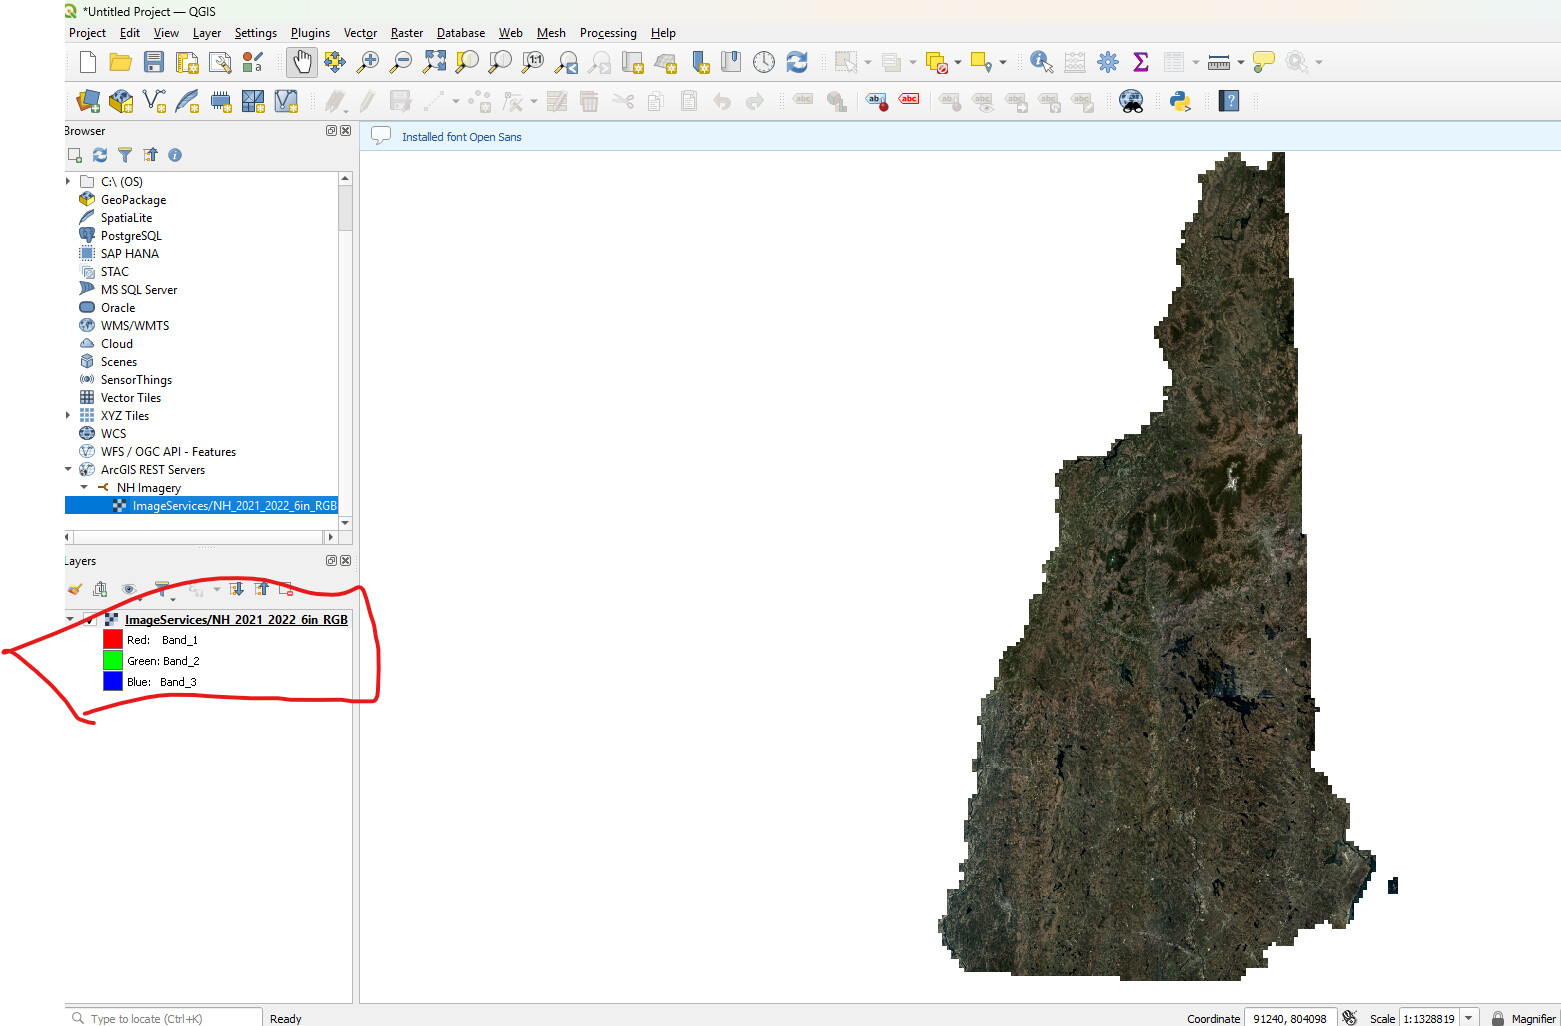
Expand the arrows to find your imagery layer. Right click on it and select Add to Project. If it asks about a transformation, just pick the default. Your map now has the imagery layer in it. Repeat these steps for any other layers you may want to search for (Parcels, streets, streams may be good choices). They will be visible in the layers pane.

Now, let’s update our CRS so that things work more smoothly. Right click on a layer in the Layers pane and select Layer CRS → Set Project CRS from layer. This makes sure your project and layer are using the same coordinate system, and will make it easier when you create the data you want to draw with.

Now it’s time to create data! From the toolbar at the top, select Create New Shapefile Layer (looks like a stylized V). Give it a name (like “trees” or “treepoints”). Be sure to note WHERE you are saving it! Select a geometry type of Point. Optionally, select “z+m” under additional dimensions if you wish to record elevations. Under CRS (dropdown under additional dimensions), choose the Project CRS. Add an integer field in the dialog below to record the diameter of the tree. Optional, but recommended: add fields to your data to record the species, variety, year planted, etc. When you are done designing, click OK to create your shapefile.
Note: Shapefiles are actually 3-5 files that need to travel together as a group. Be aware of this when storing, sharing, or moving shapefiles.

The new layer is added to the map. To add a feature, click on the Pencil icon (toggle editing) to start editing. Then click on Add Point Features and click on the map where you want your tree. It will ask you to fill in any attributes. If you added Diameter, record that in your map units (feet, meters, etc). When you are done click OK to finish adding the point.

Click on the floppy disk to Save Layer Edits and then click on the yellow pencil to toggle editing off.

Right now, my tree is hard to see and doesn’t reflect the true size. To fix that, we will change the Symbology. Right click on the tree point entry in the layers pane and select Properties. Pick the symbology tab, and we’ll do a data defined override symbology. Click on the box next to where it says millimeters. Navigate the dropdowns as shown and select your diameter field.

Next, click where it says Millimeters and select Map Units. When you are done, it should look like this:

Make any other symbology changes you would like (color, shape, etc) and click OK to apply them. Don’t forget to save your map project! Here, you can see I have trees with 8’ and 12’ diameters:

To get info on individual trees, use the Identify Features tool and click on the tree:

To move trees, turn editing back on and select the vertex tool. Click on the tree you want to move, then click the new location. Save your edits and turn editing off.

Ok, thanks for reading! There’s so much more to this, but hopefully this is enough to get you started. I’ll also add some info later on finding data to store locally.