After some testing, I discovered that with the free version of ArcGIS Online, you can add and update your own data. This has a lot of advantages over Google maps. Once you get it up and running, it’s easier to maintain the data, and you have lots of options for how it’s drawn and labeled. Also, you have access to a wide range of additional layers that you can add to your map, such as elevation, weather, etc. Here’s how to get started.
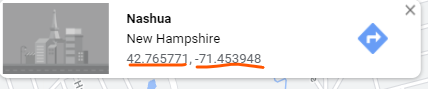
Before you begin, you’ll need coordinates for your fruit trees (or at least one general point for where your orchard is to get you started) and an idea of what attributes of your trees you would like to record. If you have a GPS unit, you can just use the GPX files. To get your coordinates, you can go to Google Maps and click on a location on or near your property. Don’t worry about getting it perfect, we can update the location(s) in the map.
Next create a spreadsheet with all the attributes you want to record, plus a field each for Latitude and Longitude. If you don’t have spreadsheet software, you can just use a text editor such as Notepad and separate the columns with commas (just be sure to include commas around blank columns, and don’t forget the column names!). You’ll want to save the spreadsheet or text file as a CSV. You can add as many rows as you want, but you only need one to get started. Make sure you have all the attributes you want, though, as you can’t add more columns later.
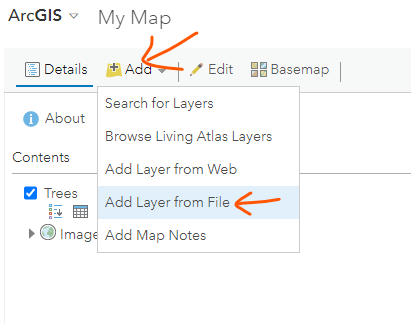
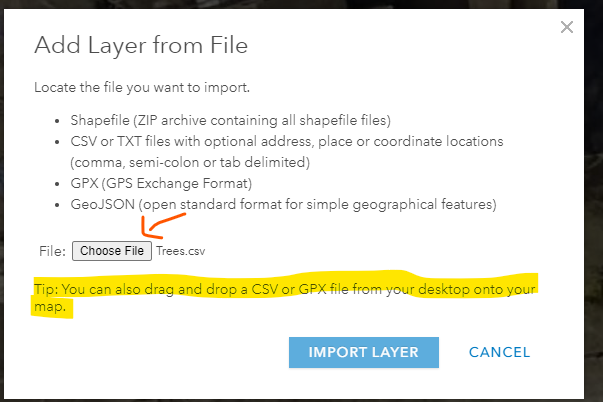
Next, you need an account with ArcGIS Online. Go to https://arcgisonline.com and go to Sign In. You can either link an account with Google, Facebook, or Apple, or you can create a new account. Once you have your account, your next step is to create a map. Click on the word “Map” at the top to open the map viewer. This will open a new blank map. At the top left, find where it says “Add” and select “Add layer from file.” Then navigate to your CSV to select it and click Import Layer (note the highlighted tip).
If you set up your CSV correctly, it will ask you how you want it to draw. You can select one of your attributes to be a unique identifier or just draw the location. You can change this later if you like. Once you set this up, you should see a point on the map at least in the ballpark of where you intend it to be. Don’t worry if it’s not quite right, we’ll edit that later.
Now’s a good time to orient you to some key menu options:
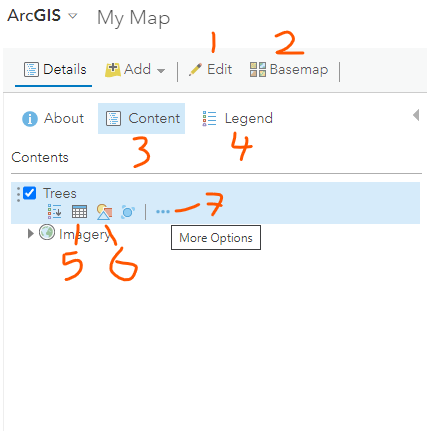
- Enables editing, which will allow you to create new features, update attributes and location, or delete features
- Basemap switcher. The default is Topographic, but you might want aerial imagery.
- Pulls up the list of layers with layer options
- Pulls up the legend of what the different symbols mean.
- Opens the attribute table, which is basically the spreadsheet behind the points.
- Opens the symbology options.
- More options - allows you to do things like save your layer, configure the popup, and configure labels.
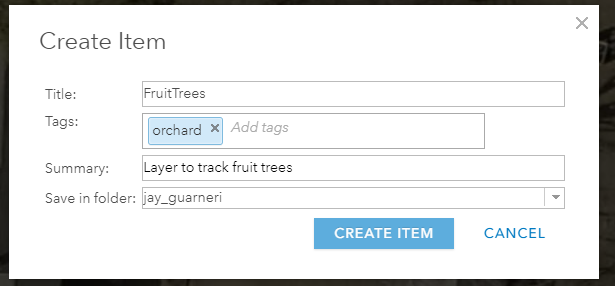
Now that you have your layer in the map, you’ll want to save your layer and your map. Select more options (7 in the pic above) and click on Save layer. You need to give it a name and some tags. You’ll do the same thing to save the map by selecting the save button just a little to the right of top center. This will make sure you can access this all next time you log in.
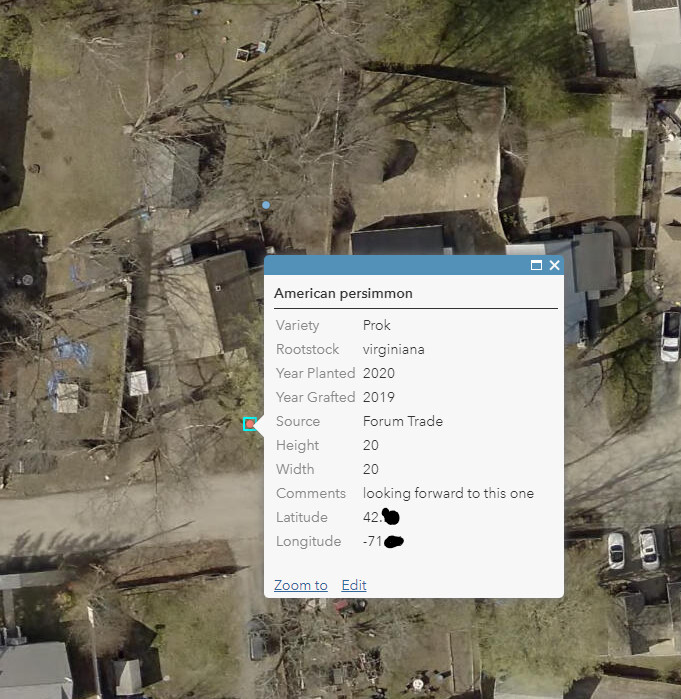
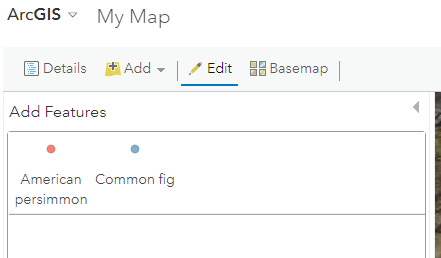
Now, we can start adding and editing features. If you click on the edit button, you will see the option to add features. If you’re symbolizing by an attribute, it will give you templates that automatically fill in that key attribute, which is useful if you have a bunch of the same kind of tree to add. Just select a template and click the place on the map where you want it. A popup will display where you can fill in the other information about the tree. You’ll also see this popup if you click on an existing point, so you can update records. To change the location of an existing tree, click on the point, then drag it where you want it. Hit Close when you are done.
If you toggle back to Contents, this will stop editing and you can navigate the map instead. Clicking on a tree will bring up the popup with the attributes. If you want to customize this a bit, pull up the More Options menu for that layer and select configure popup. You can set a title as either text you type in, an attribute (or attributes!) from you data, or a combination (use the “+” next to title to select attributes to use). You can also choose to show/hide attributes or make them not editable, or turn off the thousands separator for numeric attributes, under “Configure Attributes.” Don’t forget to save your map changes!
By default, all of your layers and maps will be visible only to you, but you can choose to make them publicly available if you want.
This tutorial just scratches the surface of what you can do with this tool, but it should be plenty to get you started. The free version is somewhat limited, but still quite powerful. I know they put some limits on how much data you can store with them, but I’m not sure what those are. It should be more than sufficient for any hobbyist grower, though. Go forth and map! @disc4tw