Something I can use to collect rain, temperature, wind, etc. I would like to be able to download the data to my PC, go back read it by the day and do averages by whatever block of times I want to look at. I was happy to see that Amazon has a bunch of them at various price brackets.
Anybody here runs one? What do you like/dislike? What would you recommend?
I bought an Ecowitt last fall. I’ve been happy with it for the price. It’s modular so you can add on components as you want, or buy them in a set. It’s also manufactured by the same company as other brands like Ambient weather. So some of the Ambient components are compatible.
I don’t like the way some of the data is presented on the web UI. It displays averages for the time period instead of highs/lows. However, support said an upcoming release would add that feature.
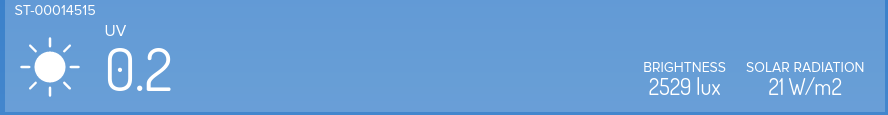
That [image] is from the web interface for my Weatherflow Tempest weather station. Built-in battery and solar charger, pretty much “set it and forget it”. Other than looking at the results of course… UV/light, rain, wind, lightning, pressure, temp…
Inside the house there’s a small unit attached to a USB charger which apparently talks RF to the outside unit, and itself connects to their servers via wifi/internet.
Mobile app, website, RESTful WebAPI, etc…
I like it. Pretty neat how it “uses AI” to calculate temp and precip amounts.
I use this map, you can edit layers and look at individual stations, including their recent history (7 days). Longer history also available but requires a data request (which takes just a few minutes)
Under the “Observations” tab, check “Surface Observations” and then which type of data to display for the stations. Zoom into your area to see your nearest stations. Click on the station to get recent history charts like this:
Sweet baby Jesus, I knew it has been dry this year but the total precipitation for this year is listed at 5.4 inches, and about one inch has been in the last few days. This is what ruined my harvest of Saskatoons :-\
How do these stations measure solar radiation? Basically I get few growth days but they can be pretty intense with 18+ hours of sunlight. I would like to measure how many sun-hours my trees are getting on a given season or block of time.
Only some of the stations seem to have solar radiation (in watts per square meter) data, but I’m not sure about being able to aggregate that over time. You’d probably want to operate your own station for that, I’d guess.
Because not all the info is available online, specially the granular long term data. Heck I’m on a valley of micro climates. I’m looking at the two stations near my house; they are 2.2 miles apart, one has a temperature of 56f the other 66f, and I’m pretty sure both are right.
I experiment with some trees and bushes that are borderline for our environs and some that I don’t think have been tried here. Next year I’m bringing a few varieties of northern grapes to see if I can get them to thrive on the ground without too many shenanigans. I like to collect data to grow or local pool of knowledge and that would help a lot.
It’s not automatic, but you can find chill hours at www.getchill.net with MesoWest weather stations. You plug in the station ID number and enter a date range. You can move back and forth between months and years of data. I used to use it with nearby personal weather stations (in my area) from weatherunderground’s Wundermap. The NOAA weather page mentioned by Swincher uses local government and utility weather stations, at least in my area(S.Calif. 90290) and I just tried the ID from the one shown above…and once I got the ID right(D5544) it worked, it gives 5 different chill hour models. In my fire prone area many of the electric poles have been outfitted with weather stations.
The Wundermap used to be the gold standard for personal weather station data, but it’s been ruined by a new owner (weather.com??. It’s worth checking out, but on my computer it’s unusable.
Choosing a backyard weather station is difficult because there are so many models. What you want (rain, temperature, wind with a PC connection) is common. What you want to do with it (averaging over custom time frames) may not be.
What follows is my being pedantic: I run Linux on my PC, not Windows. Because of this, I chose WeeWX for the software suite to monitor my weather station. It stores weather-station readings in an SQL database, and you can do whatever you want with the data. WeeWX facilitates uploading continual readings to online weather reporting services such as WeatherUnderground, CWOP, and PWSweather as well publishing your own Web pages. If you don’t have a Linux PC, you can set up a cheap Raspberry Pi to run Linux.
Here’s a sample Web page generated by WeeWX. This shows the stats normally collected and their typical presentation, but you are not constrained in any way as to presentation.
To be compatible with WeeWX, you have to choose a backyard weather station model that has a USB PC connection. On Amazon it’s not entirely obvious which models these are. Fortunately WeeWX provides a list.
[The one I have is no longer manufactured. This is yet another downside of model proliferation in the marketplace: You can’t recommend late model weather stations.]
But here’s one that’s compatible with WeeWX and seems easily available and affordable:
I currently have an Ambient Weather WS-2902C, which replaced an older Ambient Weather unit that lasted for 6 years. For those 6 years I had been using Weather Underground (WU) to display and share the data. But after installing this new unit, I checked out the Ambient Weather network and app and now I use those (but still connected to WU). Very happy with these units. The only problem is that an oak titmouse likes to perch on the anemometer and go round and round.