You’re right that there is no direct measurement of annonacin. In this paper, for example, Brine Shrimp Mortality is used as a marker for annonacin content. From Table 3, it appears that it takes roughly 10 times as much pawpaw pulp from Zimmerman, Wells, and Sunflower to attain the same lethality as Middletown, Overleese, and NC-1.
You’re also right that these relative measures do not help us understand whether the absolute levels are safe. But if (a) we agree that annonacin is a risk, and (2) we still hope to consume pawpaws, then it seems we should prefer varieties from the relatively low groups.
Finally – as a “pawpaw breeding consideration” – your genetic clusters seem correlated with annonacin levels. It would seem that a breeder who wants to produce a low-annonancin variety should use parent plants from the low groups (i.e., 2 & 4).
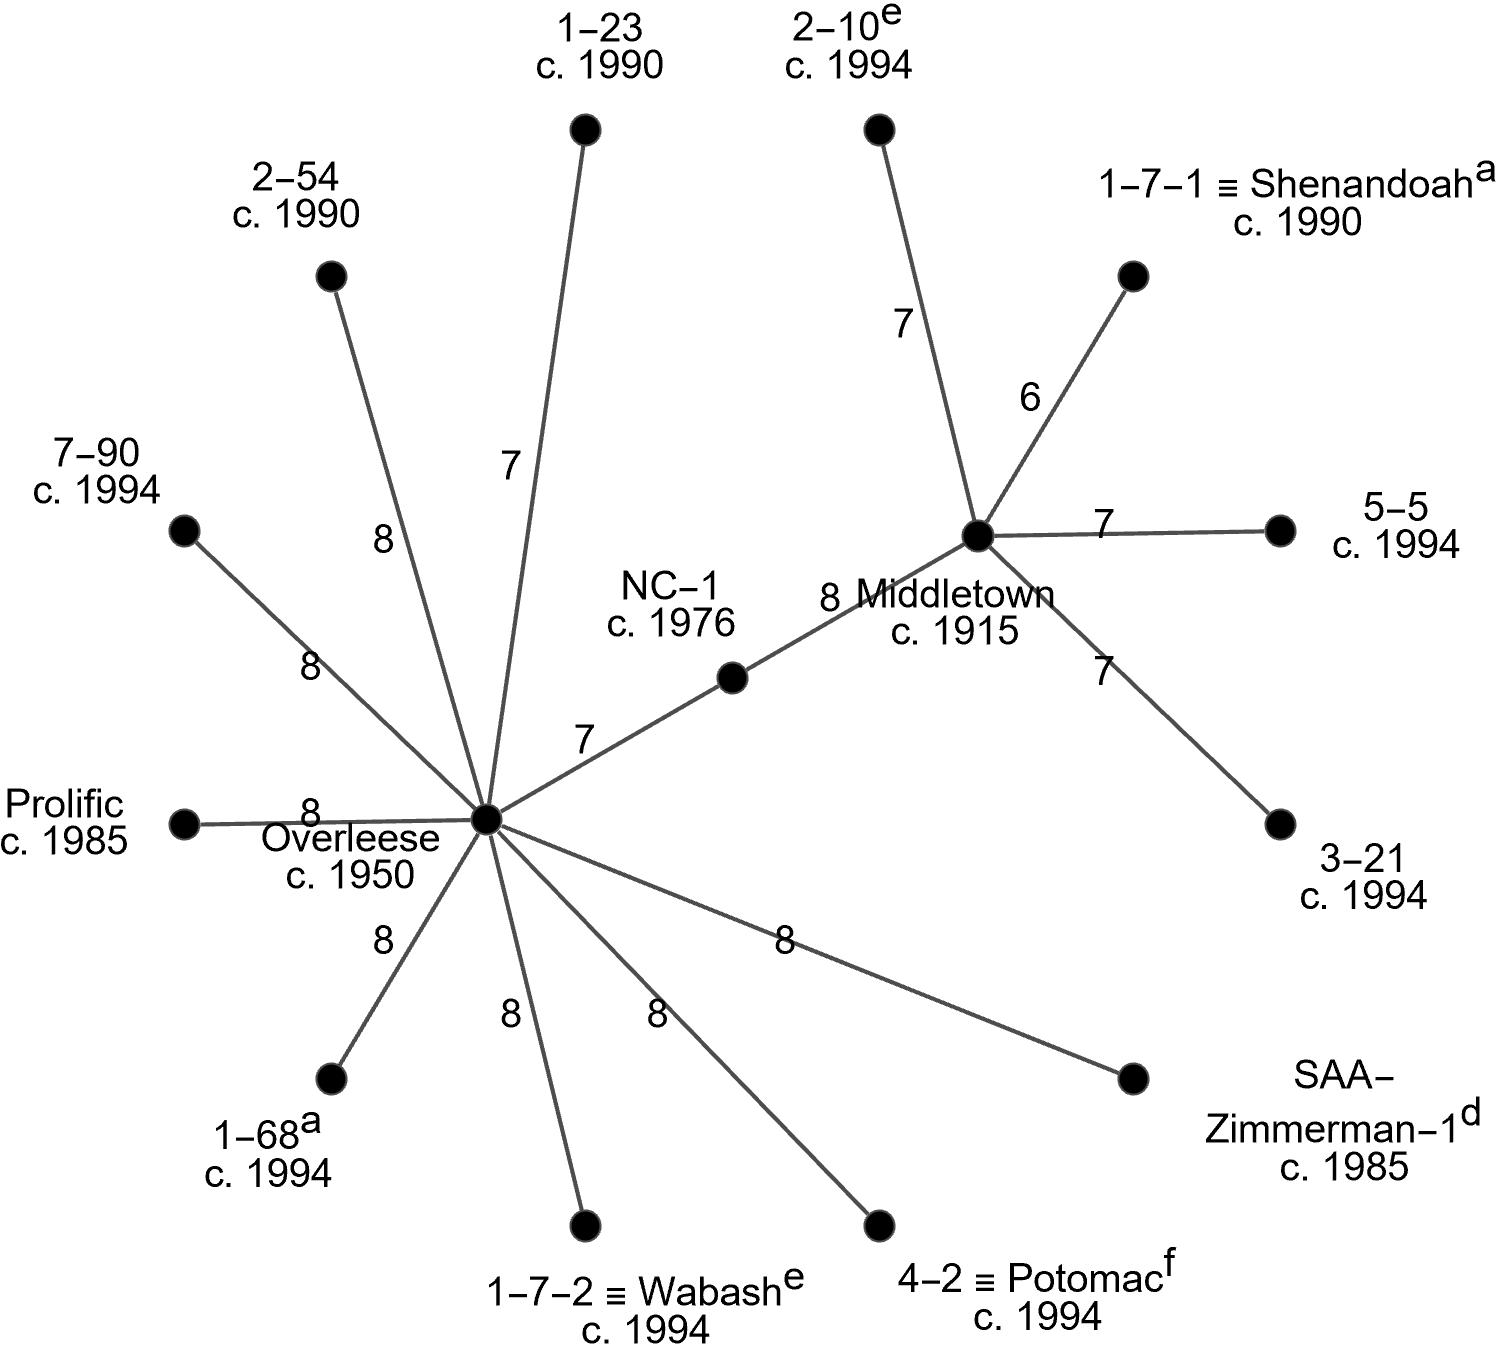
On the topic of historical breeding, here is a look at distances (number of genetic marker mismatches) between Middletown, Overleese, and their close neighbors. Keep in mind the measurements are coarse - so they might only be accurate to +/- 2. The layout of cultivars in the image is arbitrary and the lines are (obviously) not to scale. It is a topological graph.
Notice the connection of Middletown to NC-1. From this I speculate that C. Davis used Middletown in the breeding of his “Davis” cultivar, which is a known parent of NC-1.
Yes, it is an assumption. But the existence of a pattern seems to support this assumption.
Yes. Again, the similarity (high/low) of concentrations among ancestry groups seems to support this assumption. The alternative, I think, is that environmental conditions producing annonacin were accidentally correlated with ancestry.
I can’t judge Pomper’s data but the fact that it maps to your genetic groupings seems to lend it some credibility. Error tends to be random. These data are not random.
This is an induction fallacy. The classic example is: A. Lincoln wore a beard, therefore all men wear beards.
An induction fallacy. In this case, correlation does not imply causality.
Yes you can, here it is: Pomper’s SSR data.
The zeroes are missing values. Only 3 of the tested cultivars have a full set. The number of markers (2x5) is grossly less than the number of specimens (41), consequently it is mathematically under-determined and any analysis will be highly speculative. Further, Pomper et al did not use a mathematically sound method (a metric) to compute “distances” between cultivar markers. Finally, they used a faulty clustering software (Camen and Sokal pair grouping) to create cultivar groupings - and then unjustifiably split one of the groups. So the results of Pomper et al cannot be viably compared to any other study - regardless of any similarities that exist.
It’s not induction fallacy. I’m not saying that my conclusion is the only one possible, only that it seems the most likely. Take a Bayesian approach. Whatever your priors, the likelihood that annonacin is inherited is dramatically higher if clusters of related varieties have similar levels. Give me an alternate explanation.
I’m not relying on Pomper’s genetic data, rather on his data re Brine Shrimp Mortality (aka pawpaw lethality). Why is that not OK?
I read the Peterson article that you suggested. He says that NC-1 was reportedly a product of Davis (female) x Overleese (male), hand pollinated. He says that genetic data suggests differently. The genetic data comes from Pomper, who you tell me not to trust. Really? And your own analysis shows that NC-1 is closely related to Overleese. So even if Overleese is not the male parent, it seems closely related to the male parent. All my other arguments stand.
There is a more constructive and informative way to have a scientific conversation. Assumptions are a potential starting point and are present in all research.
This graph concerns distances (number of genetic marker mismatches) between Overleese and other cultivars tested by H. Huang. Values from 2 to 7 are considered close, from 8 to 11 are moderately close. Keep in mind the measurements are coarse - so they might only be accurate to +/- 2.
At the top right is “1-23”, whose only documented parent is C. Davis’s Taylor.
At 3 o’clock is C. Davis’s “Prolific” of unknown parentage.
Notice also the cultivars from J. Gordon who is known to have Overleese but also Zimmerman: PA-Golden, SAA-Zimmerman-1 and -2. The latter are crosses of Sweet Alice with Zimmerman. Unfortunately, H. Huang did not test Zimmerman or Davis.
@Jujube
H. Huang conducted 4 years of research into RAPD markers for Pawpaw: RAPD Inheritance and Diversity in Pawpaw (2000). The testing was performed in the following year: Molecular Characterization of Cultivated Pawpaw (2003).
Pomper et al did zero research. Instead they contracted with Genetic Identification Services of Chatsworth CA for selection of markers and production of marker data.
Unfortunately the lab used by H. Huang only returned 49 of his markers free from error. I have re-analyzed that data and produced what I believe is a bias-free set of 45 markers - to be published by IJCSA next month.
Next I plan to apply all of H. Huang’s markers to the 100 available cultivars in circulation and incorporate morphology as well. At current pricing this would run about $40k for error-free results.
Here is another look at Sweet Alice. Values from 2 to 7 are considered close, from 8 to 11 are moderately close, 12 to 13 are sub-average. Keep in mind the measurements are coarse - so they might only be accurate to +/- 2.
Of interest here is the isolation of Sweet Alice. Only Overleese and Sunflower can be considered independent finds and the remainder are due to ancestral parentage.
Again interesting for ancestry purposes but how the markers correlate to phenotype would be even more interesting. Additionally the trends in which markers are shared or not may be informative if patterns emerge.
Additionally, I suggest adjusting the node distances to be proportional to the number of mismatches (more fibonacci looking) , make lines gray, and bold “Sweet Alice” to improve figure readability. Just a suggestion
It is a topological graph extracted from a 45-dimensional space. Note that the displayed rotational sequence of neighbors is arbitrary and likely has no relation to the orientation of any 2D projection.
I’ve now worked out the primary ancestry group for each of the cultivars tested by H. Huang. Here’s a short table of how they compare with the questionable clades published by KSU.
As a general observation only, I think some of those are hard to find readily as an end consumer.
They exist perhaps mainly at repositories and collectors’ orchards.
Though as an academic/research endeavor this would probably not matter.